


Simulating Programs
Simulation may be launched from the Debug menu or the Debug toolbar. If necessary, the IDE will automatically compile the program first.
Simulation creates a virtual RIO device and loads the compiled code onto it. This allows you to inspect the individual ports and variables as the program runs. Additionally, the simulator can create virtual Modbus devices for the virtual RIO to communicate with. These too can be inspected and controlled in their own panels.
Debugger
Entering the debugger displays a number of panels which can be docked, undocked, and resized with the mouse. Feel free to rearrange the debugger's display as needed.
Watch Panel
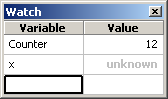
The watch panel allows you to inspect and modify the program's variables. Simply enter the variable's name in the first column and the variable's value will be displayed in the second. Recently modified values are highlighted in bold.
You can modify a variable's value by altering a value in the second column.
Local Panel
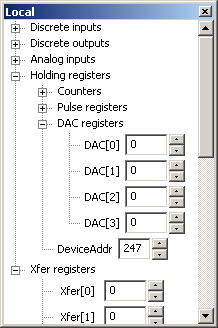
The local panel allows you to inspect and modify the RIO device's local ports such as DIs, DOs, and various holding registers. The local ports are arranged in a tree structure; the branches of which can be expanded or collapsed with the click of a mouse. Recently modified values are highlighted in bold.
Serial Panel
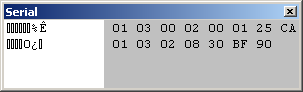
The serial panel tracks serial data sent and received over the RIO device's serial port. The left side of this panel represents this data as text and the right portion is represented as hexidecimal bytes.
There is no differentiation made between data sent and data received.
You can clear the serial panel with an option from the context menu. Simply right-click on the panel's contents and choose "Clear".
Working Panel

The working panel indicates when the debugger is busy by spinning the arrows.
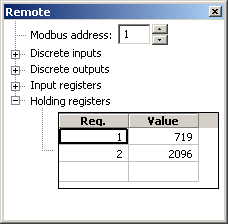
Remote Panel
The debugger will not open any remote panels when debugging a new project. To open a remote panel, select "New remote device" from the Debug menu or click the remote panel button from the debug toolbar.
Each remote panel represents a single virtual Modbus device. Each device has its own Modbus address set with the spin control at the top of the panel. The device will respond to all read and write requests directed to this address.
The remote registers are organized with a tree. You can expand or collapse the branches with your mouse.
Define the device's registers by entering values in the panel's spreadsheets. Put (zero-based) register indexies in the left column and values in the right. Any incoming requests for an address not listed in the table will cause the virtual device to return an error code 2 (IllegalDataAddr).
Single Step
Progress through your program by single stepping. You can step forward by hitting the F8 key, selecting Step from the debug menu or by clicking on the step button on the debug toolbar.
The next instruction to be executed is marked with a green triangle. The marker will move along your program as you step.
Auto Step
Select auto step from the Debug menu to automatically step through the program. You can configure the auto step speed from the Debugger pane of the settings dialog.
Hit F12 to halt auto stepping or select Break from the Debug menu or debug toolbar.
Breakpoints
A breakpoint can be set on most any line or flowchart object. These breakpoints are indicated with red circles to the left of the instruction. To toggle a breakpoint, select the line or object and hit F9 or choose "Toggle breakpoint" from the Debug menu.
Execution will halt if it reaches a breakpoint while running or auto stepping.
You can clear all breakpoints at once by selecting "Clear breakpoints" from the Debug menu.
Run
To run your program at top speed, hit F5 or select Run from the Debug menu or debug toolbar. This will step through your program without wasting time by updating the screen with each step.
Execution will continue until the debugger hits a breakpoint or you stop execution with F12 or by clicking Break from the Debug menu or toolbar.
Run To
You can also run to the currently selected line or object by choosing "Run to" from the Debug menu.
Context Menu
Most debugging commands can be accessed from the context menu.
Right-click on an object, line, or selected text to access the context menu.
Set Next
The "Set next" option on the Debug menu moves the execution pointer (the green triangle) to the selected line or object. This is a handy way to test another execution path.
Restart
To restart execution from the beginning of the program, hit Shift-F5 or select "Restart" from the Debug menu.
